Python性能分析 (Profiling)
此頁由 Linux Wiki用戶Chenxing 於 2012年3月21日 (星期三) 07:02 的最後更改。
出自Linux Wiki
提示:此文已超过 13 年(5081 天)未更新,如发现内容过时或有误,欢迎改进:)
性能分析(Profiling)可用於分析程序的運行時間主要消耗在何處,以便有效優化程序的運行效率。
Profiling可分為兩步,一是運行程序收集程序不同部分運行時間的數據,二是數據的可視化和分析。
目錄 |
Python Profiling數據採集
cProfile
Python的cProfile模塊可用於數據採集,適用於Python 2和Python 3。其調用方法很簡單:
import cProfile
# 以下调用将运行函数somefunc(),并将相关数据记录到log_file.pyprof
cProfile.run('somefunc()', 'log_file.pyprof')
更多信息請參考Python Profiler文檔。
有些小程序也可以直接從命令行調用cProfile模塊執行[1]:
python -m cProfile -o profile_data.pyprof script_to_profile.py
hotshot
hotshot是高性能的Profiling數據採集工具,其運行時對程序效率的影響很小,但會產生巨大的運行記錄,分析也比較慢。[2] Python 3中沒有hotshot。故如無特殊需求,請使用cProfile。
import hotshot
profiler = hotshot.Profile("hotshot.log")
profiler.run('trackStereo.solveStereoNew()')
數據可視化
Gprof2Dot
Gprof2Dot可將多種Profiler的數據轉成Graphviz可處理的圖像表述。配合dot命令,即可得到不同函數所消耗的時間分析圖。以處理cProfile的記錄為例[3]:
# 运行程序记录数据:
# python -m cProfile -o profile_data.pyprof path/to/your/script arg1 arg2

# profile_data.pyprof是获取的数据;dot命令需要安装Graphviz才能用
gprof2dot.py -f pstats profile_data.pyprof | dot -Tpng -o output.png
Run Snake Run
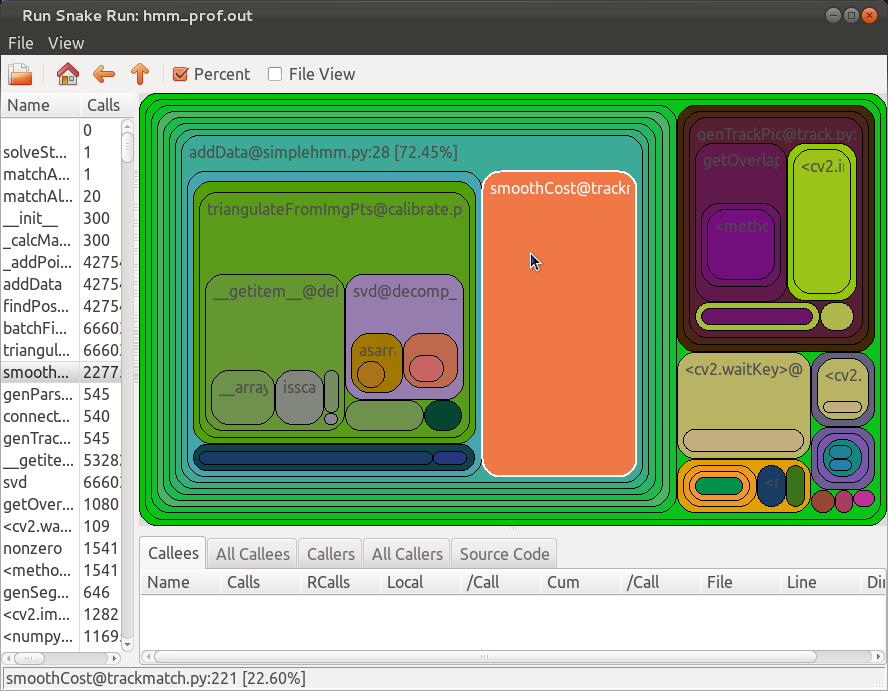
RunSnakeRun是個Python腳本,使用wxPython將Profiler數據可視化,效果如圖。
RunSnakeRun還可分析內存佔用,但仍處於實驗階段。[4]
KCacheGrind
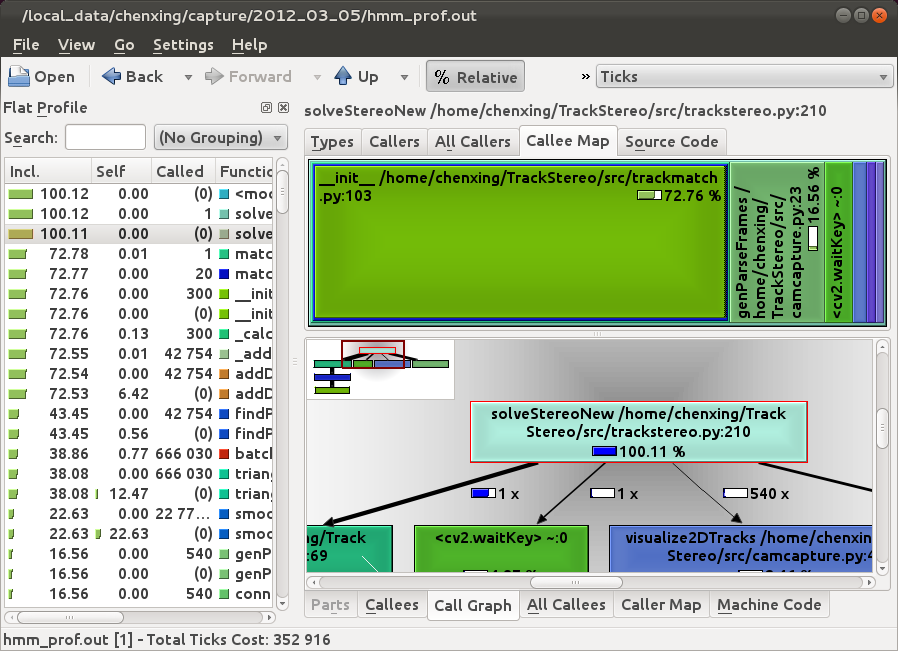
KCacheGrind是Linux中常用的profiling visualization軟件,其默認可處理valgrind的輸出。通過一些腳本也可以讓其分析cProfile或hotshot記錄下的數據。
處理cProfile的數據可使用pyprof2calltree:
# 运行程序记录数据:
# python -m cProfile -o profile_data.pyprof path/to/your/script arg1 arg2

# 使用pyprof2calltree处理数据并自动调用KCacheGrind
pyprof2calltree -i profile_data.pyprof -k
處理hotshot的數據可使用KCacheGrind中的hotshot2calltree命令:
# 使用hotshot2calltree处理数据,完成后需手动在KCacheGrind中打开输出文件
hotshot2calltree hotshot.log -o hs_calltree.log
參考資料
- ↑ StackOverflow: Using cProfile results with KCacheGrind
- ↑ Python官方文檔:hotshot
- ↑ Gprof2Dot
- ↑ RunSnakeRun
本文对您有帮助?分享给更多朋友!
反馈与讨论
发现文档不全面、有错误却没时间编辑文档?想分享自己的经验或见解?欢迎在此留言、讨论。


